Designing A Dynamically-Priced Parking Management System
The Upshot:
Urban parking management sits at the crossroads of traffic flow, economic vitality, and quality of life. In El Paso, Texas, mismatches between parking supply and demand are widespread — some areas are overwhelmed, while areas sit underused. We designed a system to manage on-street parking in the city by creating data-driven parking districts and performance metrics for measuring street utilization. All of this is then summarized in a comprehensive dashboard that allows the city’s planners to understand the entire parking situation on just one page.
Performing Data-Driven Districting:
We proposed to use price parking at a district level rather than a block level due to the improved interpretability and speed of implementation. However, we evolved upon the existing methodology by creating parking districts through clustering blocks based on their respective demand patterns. Here, we built upon the work of Fiez & Ratliff (2017) and Delmelle (2017) to perform a spatial-temporal clustering based on their occupancy rate trajectories (a temporal feature) and their geographic location.
By grouping blocks that have similar occupancy trajectories, the city can tailor parking policies within the district to their respective unique patterns. For example, we found that the government / industrial district had a strong weekday surge in occupancy but had a dramatic drop in demand on weekends. Knowing this, policymakers can look at reducing weekend rates or even reclaiming them on weekends for community events, vendors, or public space.
Studying Measures of Street Utilization:
An initial challenge was to determine how the team would propose measuring the utilization of a block. It was suggested that the preferred metric used by most cities, the mean occupancy rate, may be misleading. This was because the negative outcomes associated with high block occupancy are not linear with the mean occupancy rate. For example, the externalities of underpriced parking are the increased traffic from cruising drivers looking for parking does not increase with occupancy. Instead, this impact occurs immediately when a new driver wishes to park at an already full block and must now cruise to find a new lot.
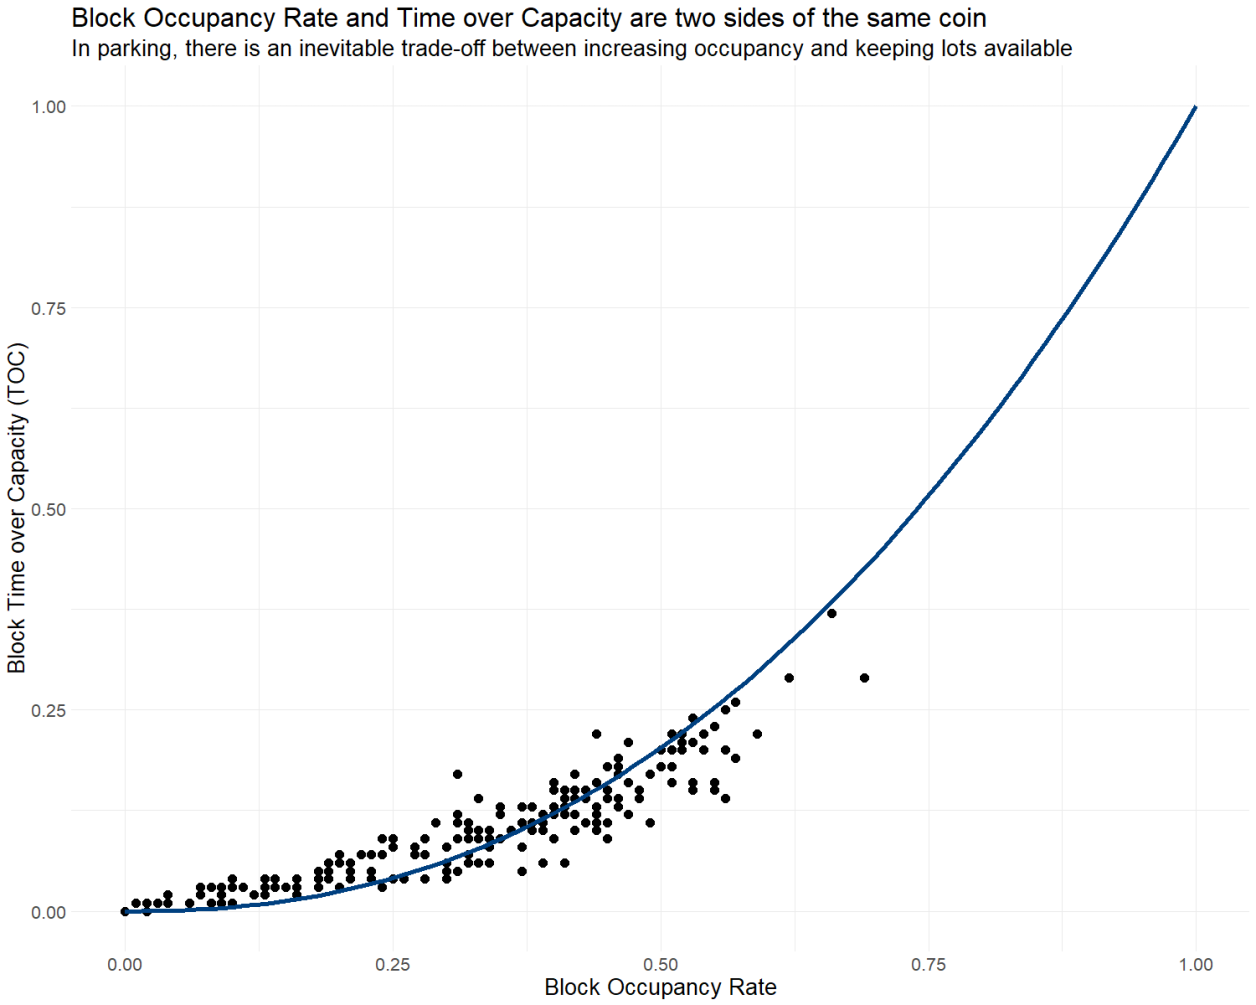
We explored a new metric in “Time over Capacity (TOC)” which represents the proportion of time where a block is at or above 80% capacity. Given that most blocks in El Paso have 10 or fewer lots, this metric represents how long we expect the street to be causing externalities due to high occupancy.
However, we found that the mean occupancy rate and TOC were tightly intertwined in the context of El Paso. This suggests that there is an unavoidable trade-off between the two.
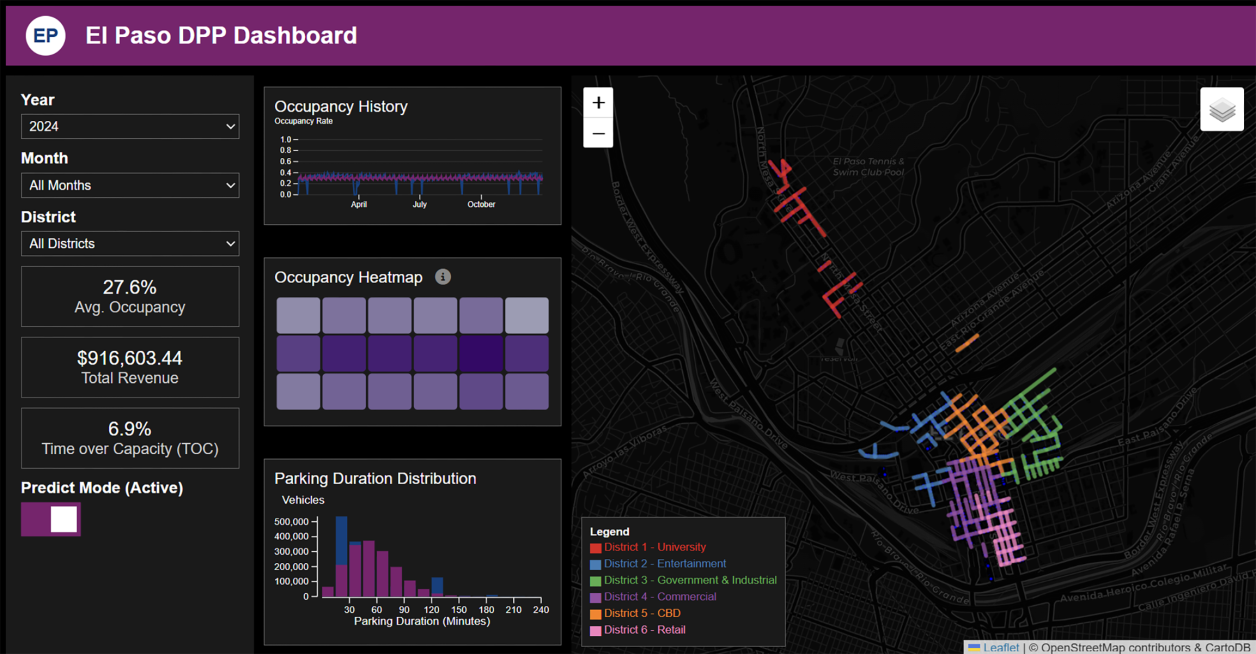
A Comprehensive Dashboard:
The dashboard was designed to support planners in making pricing decisions in the city. At one glance, the dashboard showcases key metrics about a district and provides a visual guide on demand spikes in the district. The driving idea for the app was to make it a visual tool for planners to discuss parking patterns and justify their decisions to people not familiar with parking policy.
Citations:
Delmelle, E. C. (2017). Differentiating pathways of neighborhood change in 50 U.S. metropolitan areas. Environment and Planning A, 49(10), 2402-2424. https://doi.org/10.1177/0308518X17722564 (Original work published 2017)
Fiez, T., & Ratliff, L. (2017). Data-driven spatio-temporal analysis of curbside parking demand: A case-study in seattle. arXiv preprint arXiv:1712.01263.
Learn more
GitHubApp
Link to slides