Sounding a Warning for Urban Biodiversity
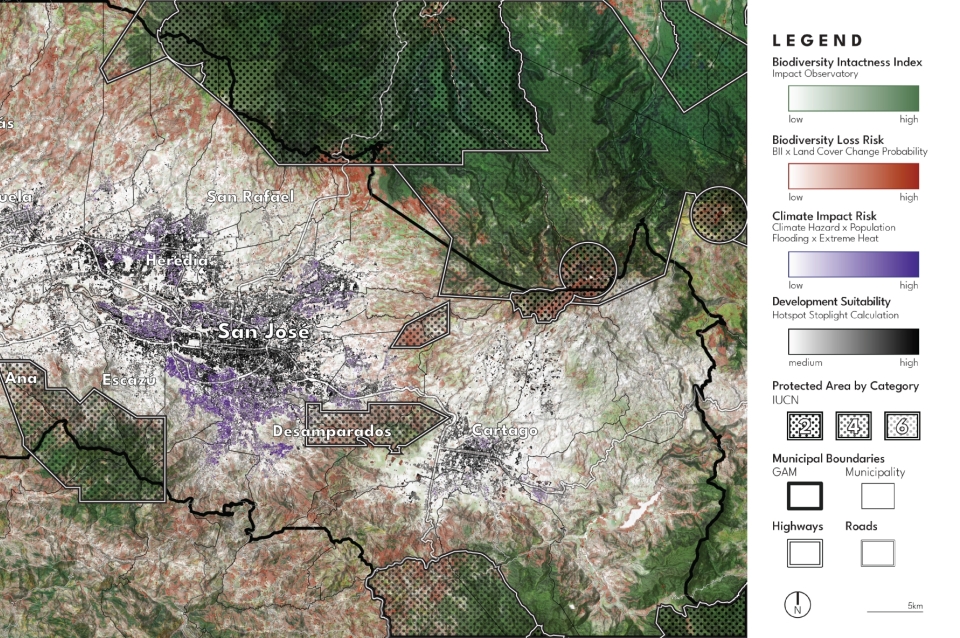
Hotspot Stoplight uses a series of scripts to connect geospatial data to machine-learning models that classify land types and predict changes in land cover. This map shows our risk and suitability indices for Costa Rica in a disaggregated way, with biodiversity loss risk in red, climate impact risk in purple and urban development suitability in black. Each of these indices varies across space, which is shown in this visualization through the varying opacity of each color.
 View Slideshow