
Metabolism of Urban Location
Travel Time and the Morphology of Cities
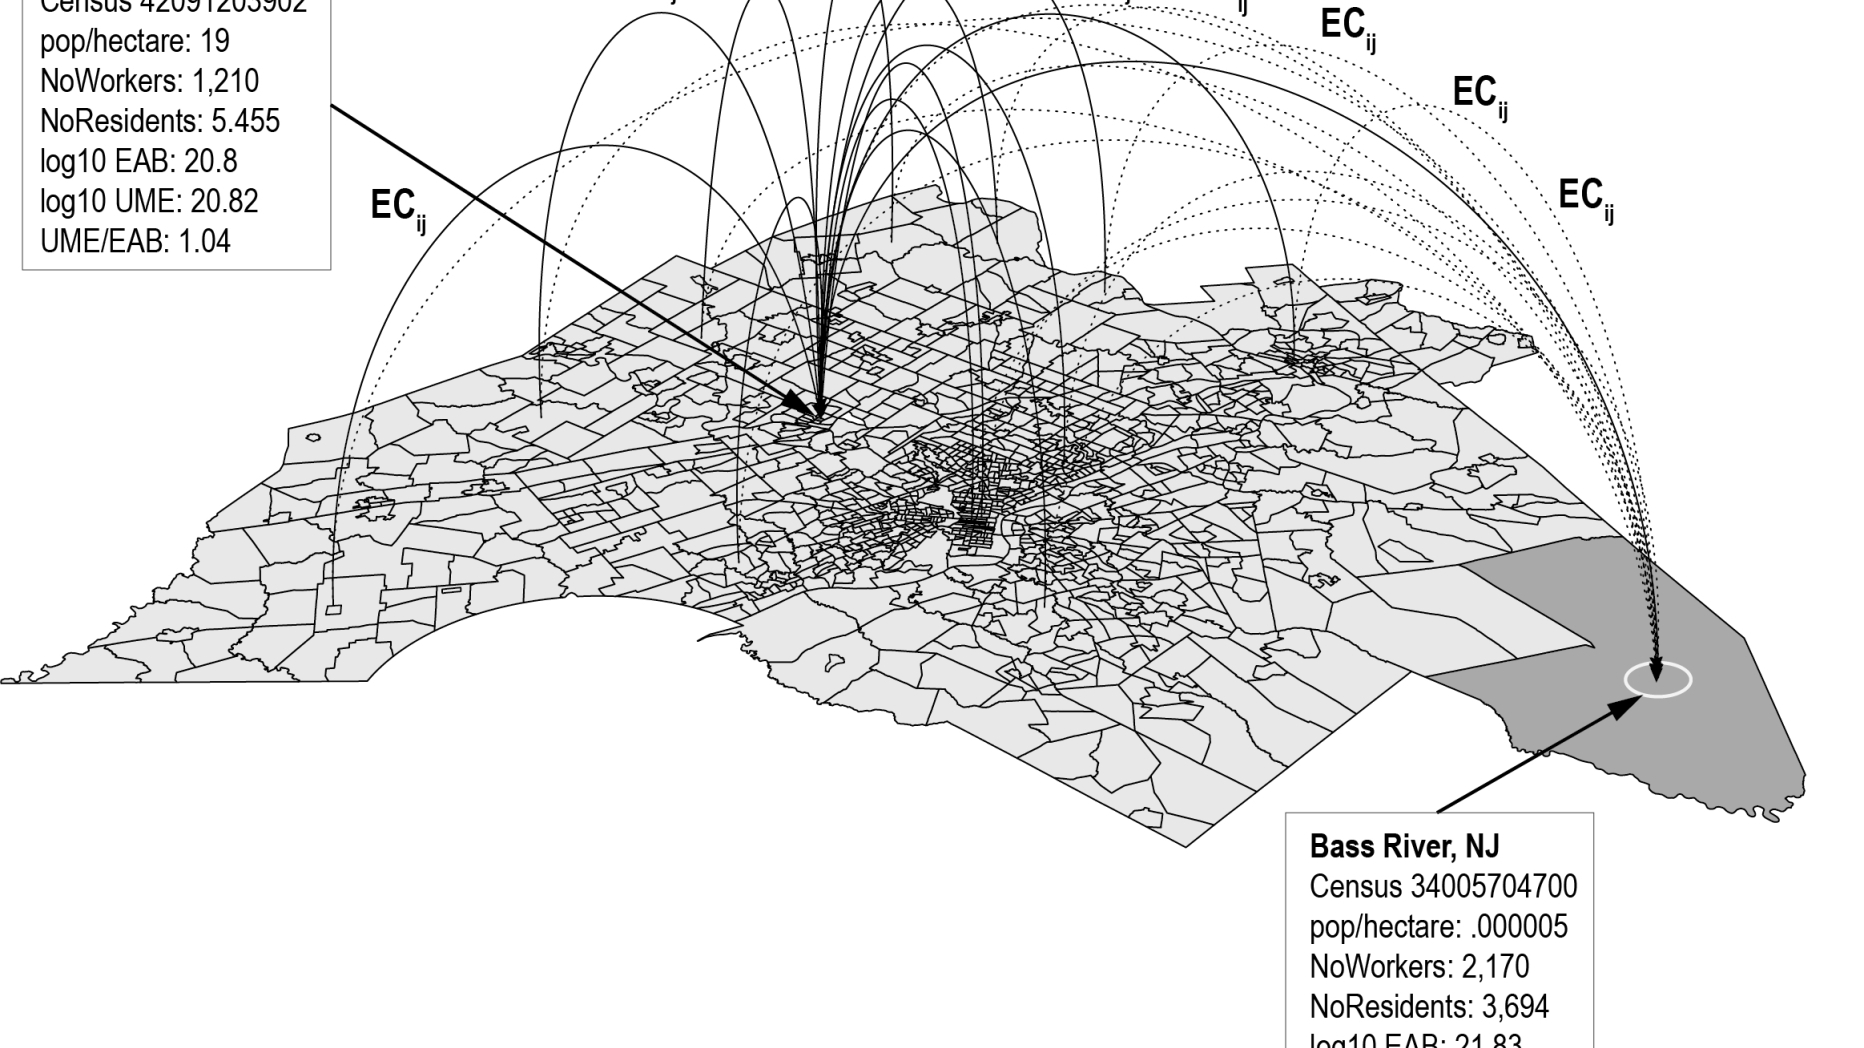
Diagram of Philadelphia region illustrating the benefit received by two different locations, an exurban center, Norristown CBD, and a rural township, Bass River, NJ. Each receives some benefit from each of the other 1,378 census tracts, but the UME of Norristown is double its EAB, while that of Bass River is reduced to 70%.
 View Slideshow
