
To Drop CO2 Emissions, Look to Local Transportation and Housing
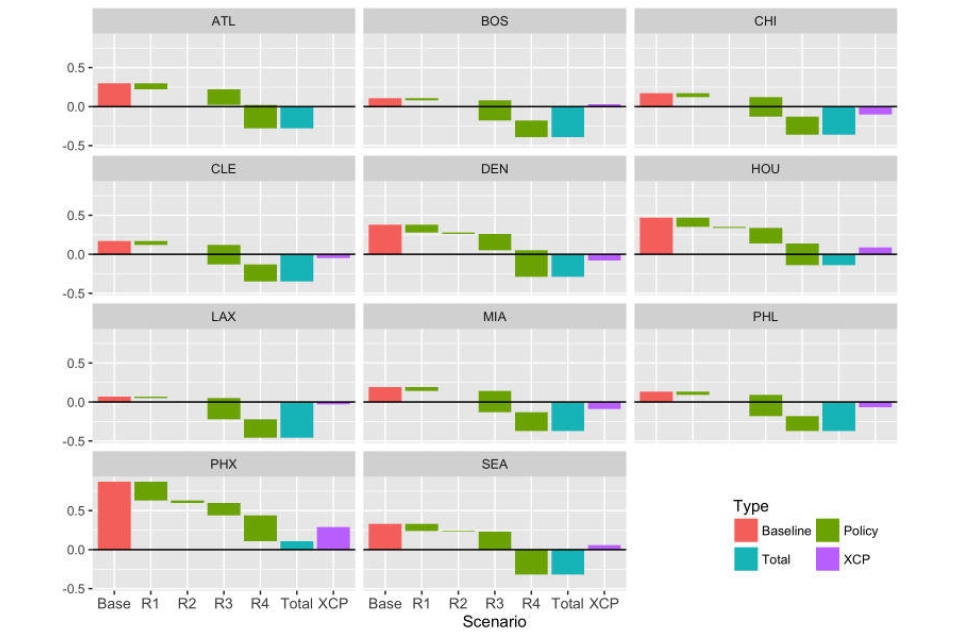
Penn and MIT researchers looked to the housing sector as one way localities could impact greenhouse gas emissions. These graphs showcase a sequential comparison of 2030 residential energy-conservation scenarios for 11 metro areas. Red represents the baseline. The other three colors signify different scenarios, with and without the Clean Power Plan. In the best-case option, CPP stays in place and cities adopt energy-conservation standards for new homes and retrofitting standards for existing home. Then emissions could potentially drop by 46 percent, on average.
 Expand Image