 Expand Image

This post showcases some of the impressive first semester data science work by the MUSA and Planning students in Ken Steif's course, MUSA 507. The students chose from four possible spatial machine learning projects.
Students were asked to think critically about each use case and develop a machine learning algorithm that could help a stakeholder better allocate their limited resources. The students were also required to design and wireframe a mock app to better understand how stakeholders could consume the predictions.
The final requirement was to writeup their algorithms in R Markdown, in such a way that another city could pick up their code and replicate their analysis.
Let's take a look at a few of the projects.
Opiate overdoses
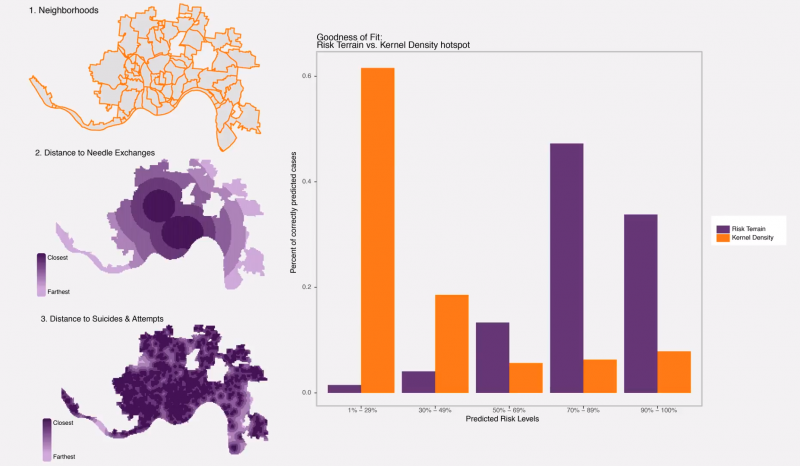
Syndey Goldstein and Justine Kone used opiate overdose data from the Cincinnati Open Data site to predict overdose risk for every location citywide. In the image below, they compare the spatial risk scores from the predictive model to a traditional kernel density model. In their video, Sydney and Justine propose to use their model to inform a safe-injection site program.
Predicting ambulance demand
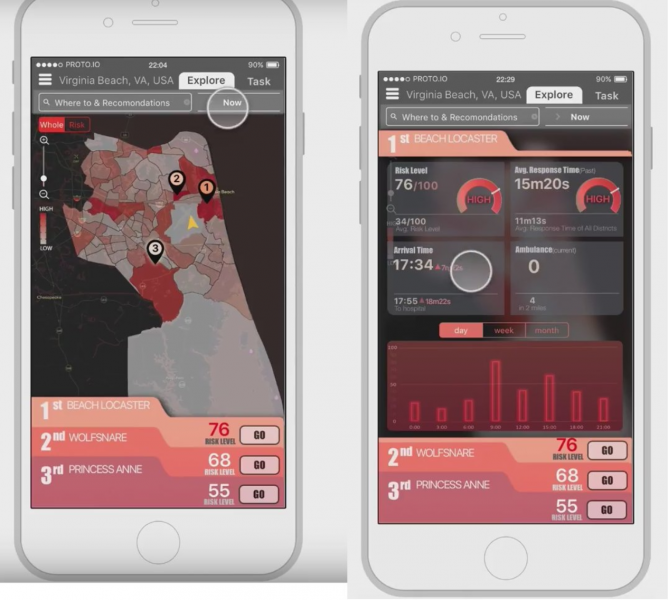
Yiwei Liu Shuhan Xu worked with EMS dispatch open data from the City of Virginia Beach to forecast ambulance demand. Their app was designed to position ambulance drivers in a given neighborhood to more efficiently allocate EMS services in places and at times where they are most needed. Here is their video.
Bike share rebalancing
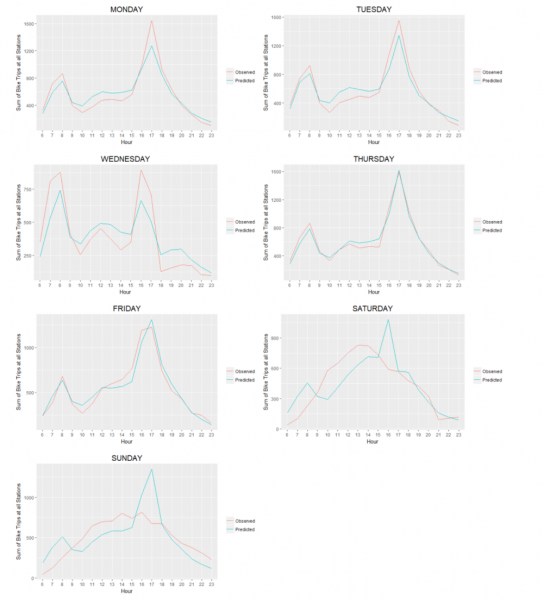
Yishi Liu and Yinuo Yin took on the task of forecasting 'Divvy' bike share demand in Chicago to create a bicycle rebalancing application. Bike rebalancing is a critical function that bike share systems must undertake in order to make sure that there is always a bike for the taking or a empty dock for drop off.
In their markdown, Yishi and Yinuo employ some interesting modeling approaches building a series of time lags and spatial predictors into their poisson regression. Below you can see how their predictions compare to the observed bike share trip counts by day, for a given week.
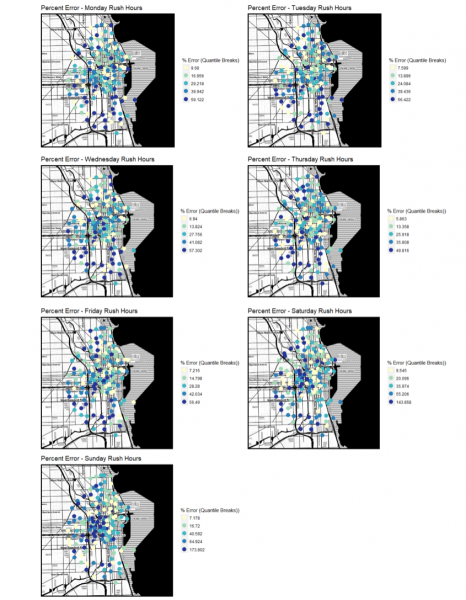
The below map shows the percentage of prediction error, by day, for each station in the study area. These maps show that the students were able to remove most of the spatial autocorrelation in their model.
Predicting restaurant inspection failures
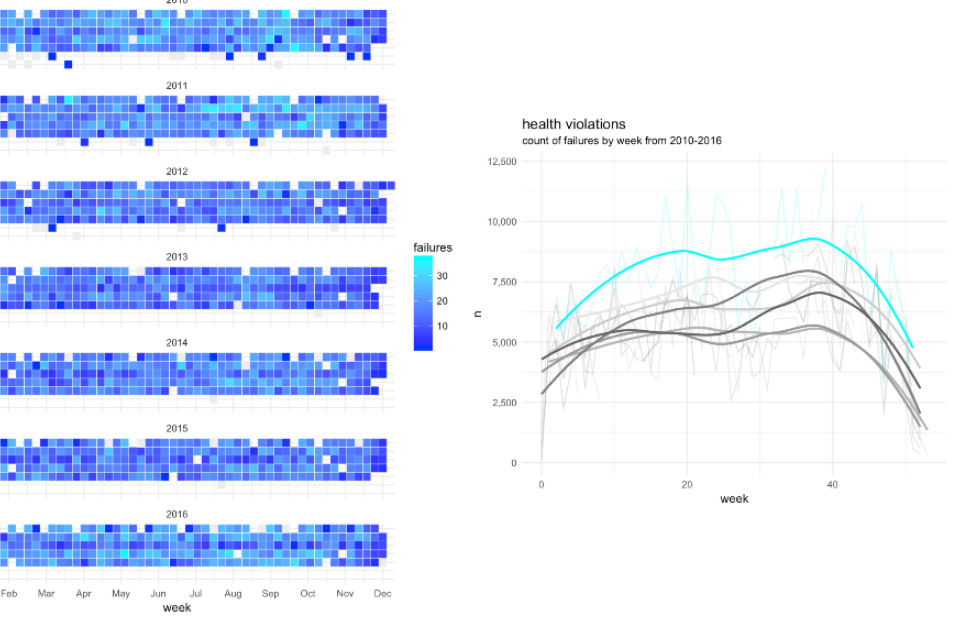
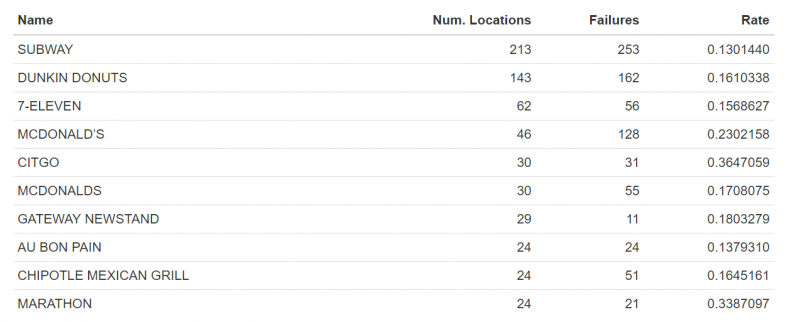
Andrew Renninger and Chris Salzano replicated the Chicago restaurant inspection project featured here. The began with some interesting explanatory analysis. The figure below looks at failure rates by restaurant chain.
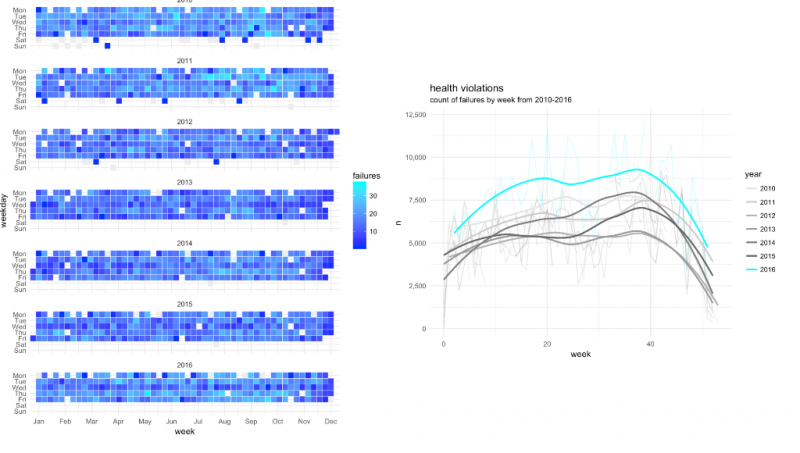
The group also looked at some time-based indicators of inspection failure as well.
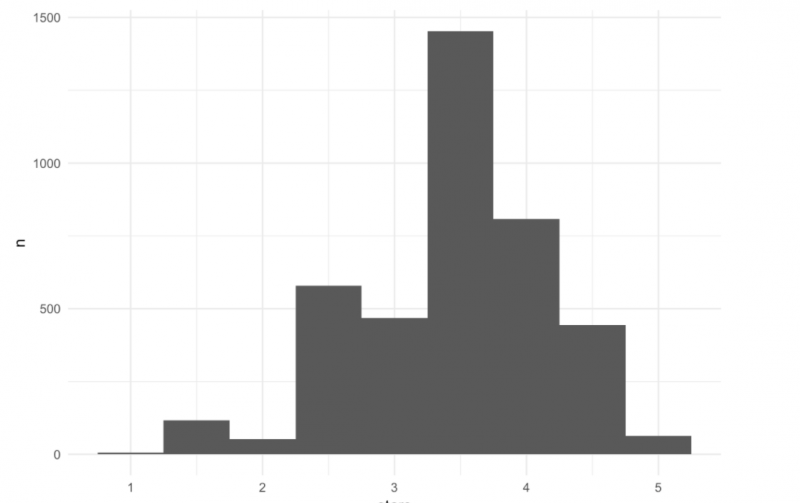
Andrew and Chris also took an innovative approach to feature engineering, using the Yelp API to download ratings data for every establishment in their dataset. Here is the distribution of ratings Citywide.
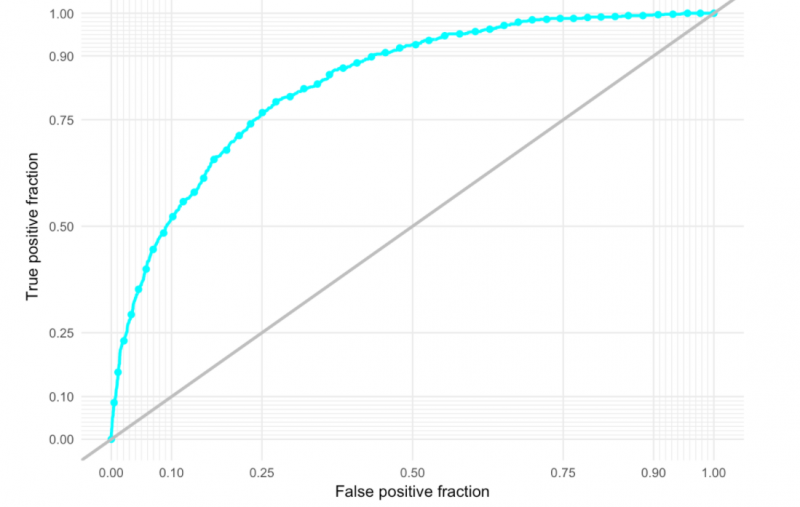
They trained their model on 2015 data and predicted for 2016. Below is the ROC Curve using the out-of-sample predictions (2016 data). AUC = 0.83.
The team created a function to determine the appropriate probability threshold to limit the number of false positives and false negatives. For a first foray into machine learning, this team, like many others in the class, came away with some incredibly impressive work. If you want to check out this team's entire markdown document, you can download it here and open it in a browser.
The work from this past fall has certainly prepared the MUSA students for their Spring Practicum where they will work on data science projects for cities including Louisville, Providence, Philadelphia and Minneapolis.