 Expand Image

Below is a sampling of what our students accomplished spring semester 2017. The below excerpts were edited slightly for conciseness.
Yun Shi – Smart Select
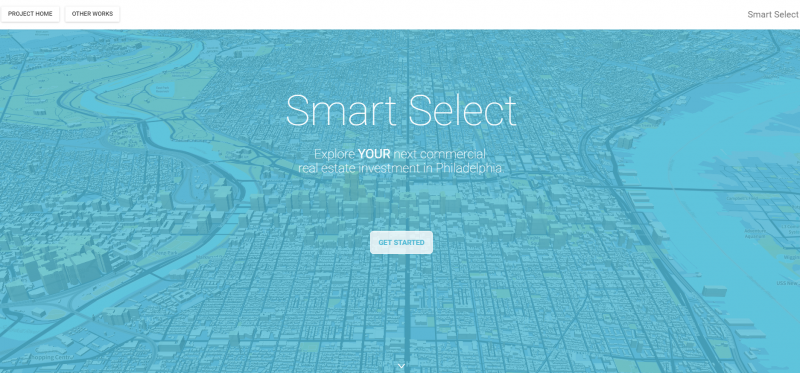
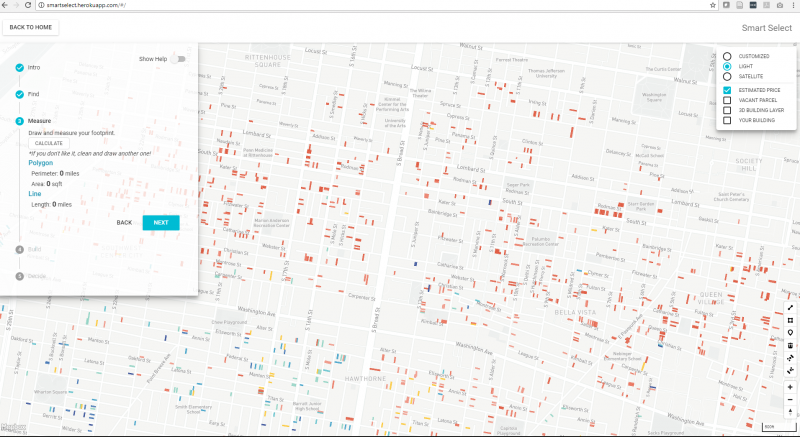
Smart Select is an interactive map for non-experts created to explore commercial real estate investment opportunities by predicting apartment prices in Philadelphia. Here are the use cases:
- Find an investment opportunity
- Explore the real estate in the city
- Understand which factors are matter most when valuing apartments
Claire Douglass – Property Values and the 2nd Avenue Subway
New York City has one of the largest and most expansive transit networks of any city in the world. The completion of the first phase of the Second Avenue Subway has helped close this connectivity gap, bringing a significant new transit infrastructure project to a historically neglected part of the city.
With such a distinct change to the neighborhood comes speculation about what it might mean for local residents and surrounding property values. Rising rents and higher sale prices could mean pricing people out of this once relatively affordable uptown neighborhood. But how strong is the connection between transit and property values? And to what degree, and at what timeframe might the neighborhood begin to feel these shifts?
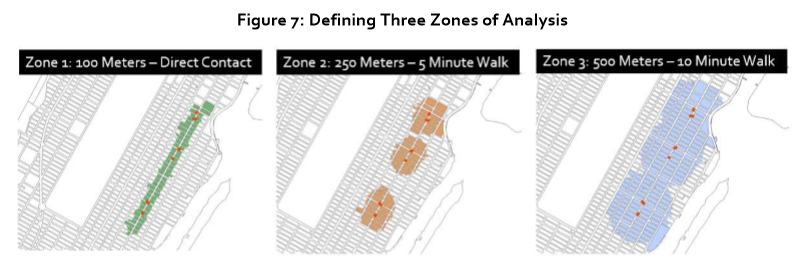
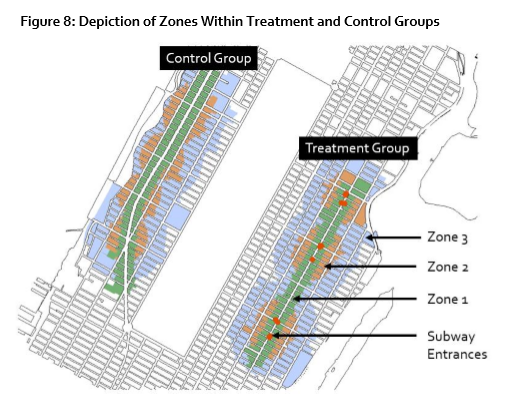
The primary goal of this project is to use spatial analysis and statistical methods to determine whether the presence of three new subway stops on the Upper East Side has directly impacted real estate prices in surrounding areas.
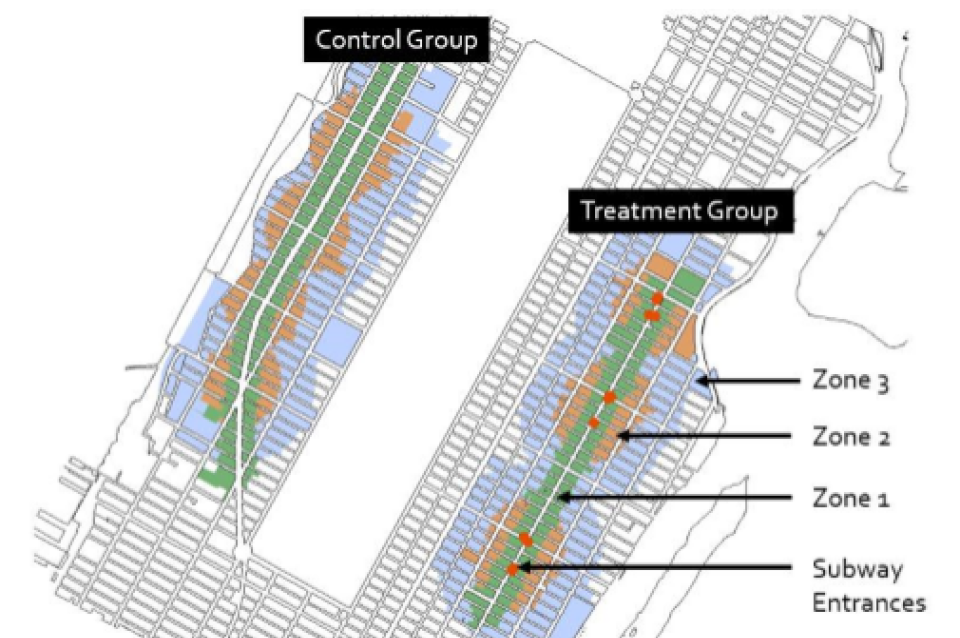
This form of analysis is completed using a Difference in Differences model. This model mimics traditional experimental design, where a treatment and control group are defined and compared. This analysis sets us up to better understand the counterfactual, and specifically ask the question “would the changes in real estate prices have occurred had the subway not existed?”
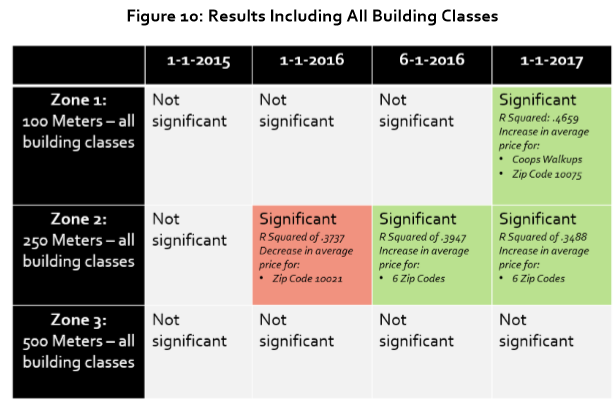
Overall, results show statistical significance at smaller spatial scales for more recent event dates when all building classes are considered. This suggests that there may be some recent shifts in property sales on the Upper East side surrounding the three new Second Avenue subway stops at both the 100 Meter and 250 Meter scales as early as June 1, 2016.
Yipei Zhang - Pattern Detection & Prediction of Chicago Taxi Trips
This project explores the spatial-temporal patterns of taxi service in Chicago, creates an interactive and animated map showing the pattern on a community level, and develops an web-based application that recommends potential taxi pickup locations.
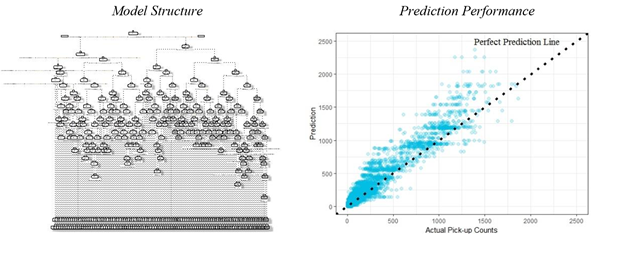
Variables extracted from two pattern sets are applied in the prediction of taxi trips. The project provides some insights into urban transportation system and also increases the efficiency of taxi service. With an accurate prediction, the amount of cruising for customers will decrease and taxi service will be more competitive in the contest with ride sharing companies.
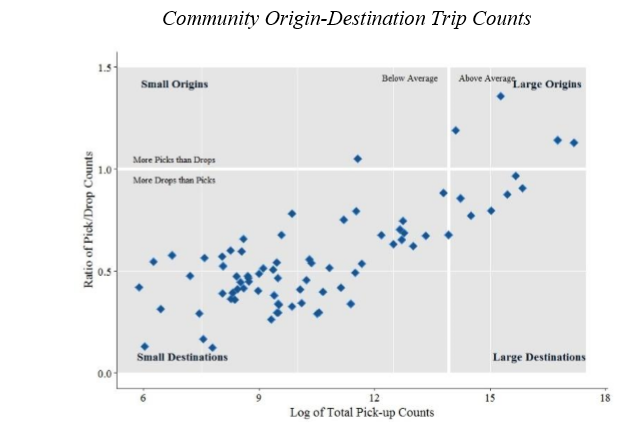
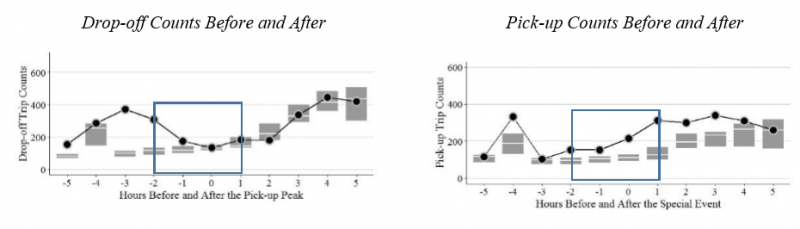
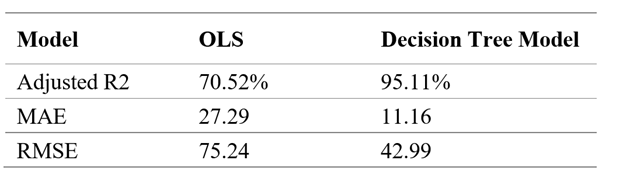
Modeling special events - We set out to test whether special events were a significant predictor of taxi trip variation. We were curious if the amount of drop-offs before the event was similar to the amount of pick-ups after the event. Here was an example of the outlier mentioned above. To build and modify the predictive model, the model was trained on data from 2013 to 2015 and tested it on data of 2016. Then all taxi trips in May from 2013 to 2016 were used to predict the amount of trips in May in 2017. The dependent variable was the number of pick-ups in a community within an hour.
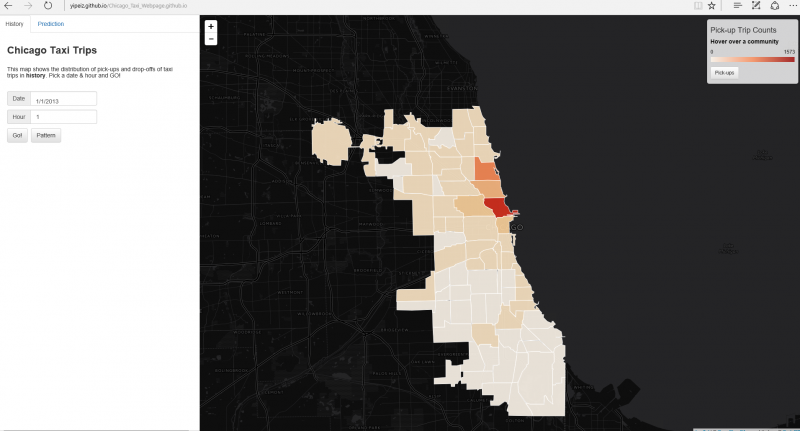
The following graphs are screen shots of the web-page. Users can choose the date and hour to see the distribution of pick-ups and drop-offs. The pattern button triggered a dynamic map showing the pick-up pattern of that day and predictions.
Jianting Zhao - Bike Smart A redefined Philadelphia bike route recommendation app
This project makes bike route recommendations for Philadelphia based on concern for bikers’ safety on Philadelphia streets. I introduce the concept “Low stress street biking” (Furth & Mekuria, 2013), which is about reducing cycling stress levels and improving biking safety.
In this project, the first goal is to use this concept as a guideline to create a rating system that reflects the bikeability of each street in Philadelphia. More specifically, I will use the street information from Opendataphilly.org and conduct a weighted overlay analysis.
The second goal is to create a useful App that recommends bikers the optimal bike routes that minimizes stress level. I would accomplish this goal by using a bike score outcome and a handful of APIs and programming languages including Google Map Javascript API.
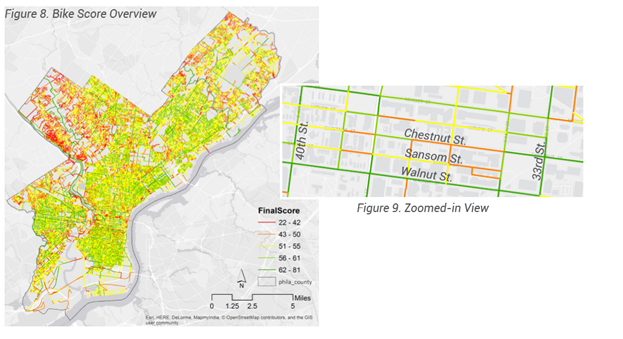
Final score is calculated as a weighted average of the below decision factors.
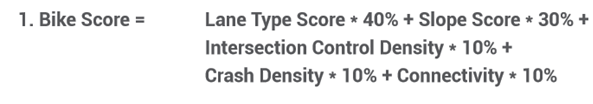
By overlaying the five criteria with their assigned weights, we get the bike score for each street segment.
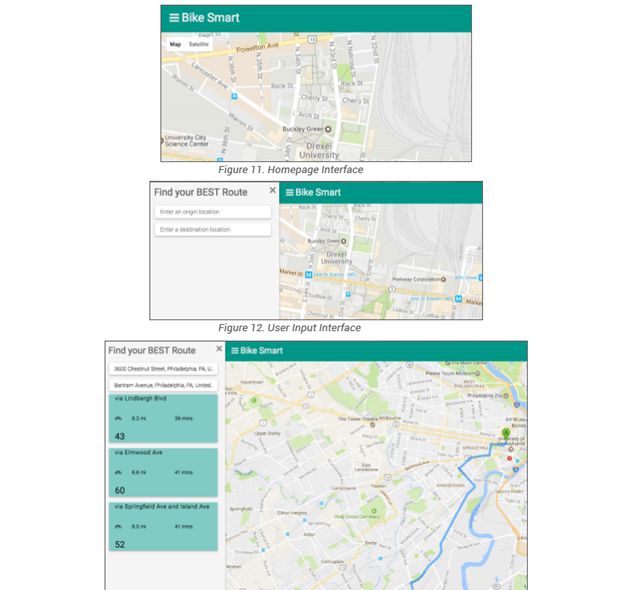
These analytics were then fed into a web-mapping application users could use to locate safe bike routes. Html, CSS and javascript were used to construct the framework. Additional libraries were used including Material Design Lite, jQuery and underscore.js. Figure 11 is the initial stage of the application; Once the origin and destination addresses were entered, the server returns several panels with trip information depending on how many trips were recommended by Google Maps API. In this example, there are three routes recommended.