
New Paper Co-Authored by Allison Lassiter Reveals Global Threat of Salt Contamination to Water Supplies
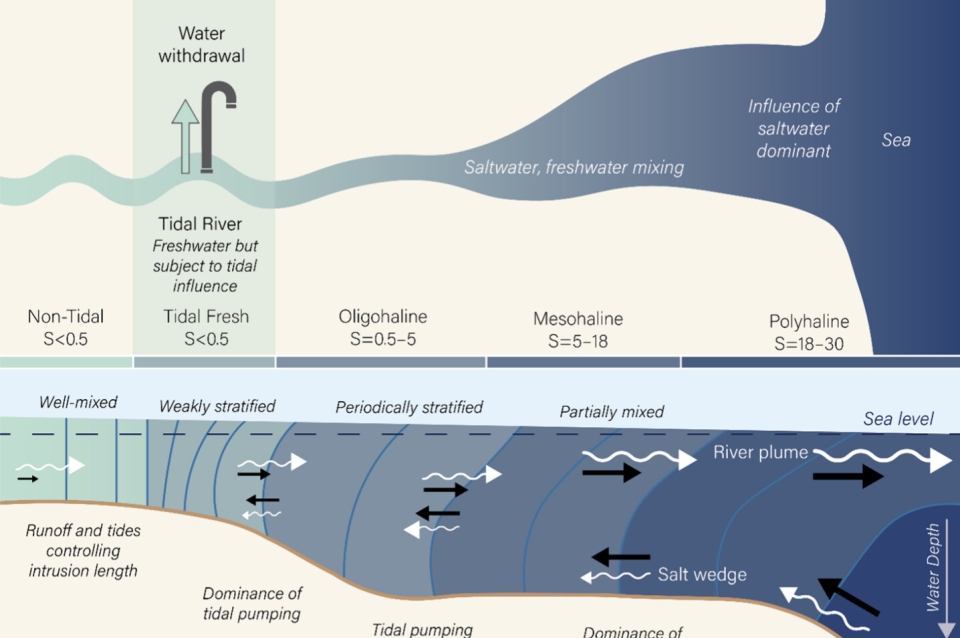
(a) A schematic plan view of an estuary showing different salinity (in units of g kg–1) subregions including the tidal river where many drinking water intakes are located. (b) A schematic along-channel section view of the typical volume and salt transport regimes in an estuary. Blue lines show isohalines, and colors show salinity. The white arrows indicate volume transports, while the black arrows indicate salt transports. The dotted line shows the position of the mean sea level. Note that for corresponding pairs of arrows, incoming and outgoing salt transports are almost identical, while outgoing volume transports are substantially larger than the incoming volume transports due to the river runoff.
 Expand Image

