This project was completed as part of the MUSA 507 course, taught in the fall of 2018 by faculty member Ken Steif.
The Motivation
Currently, the state of California is enacting regulations to help communities battle wildfire. While the state has a role to play, it is on local communities to do a better job making local land use decisions, particularly in fire-sensitive areas.
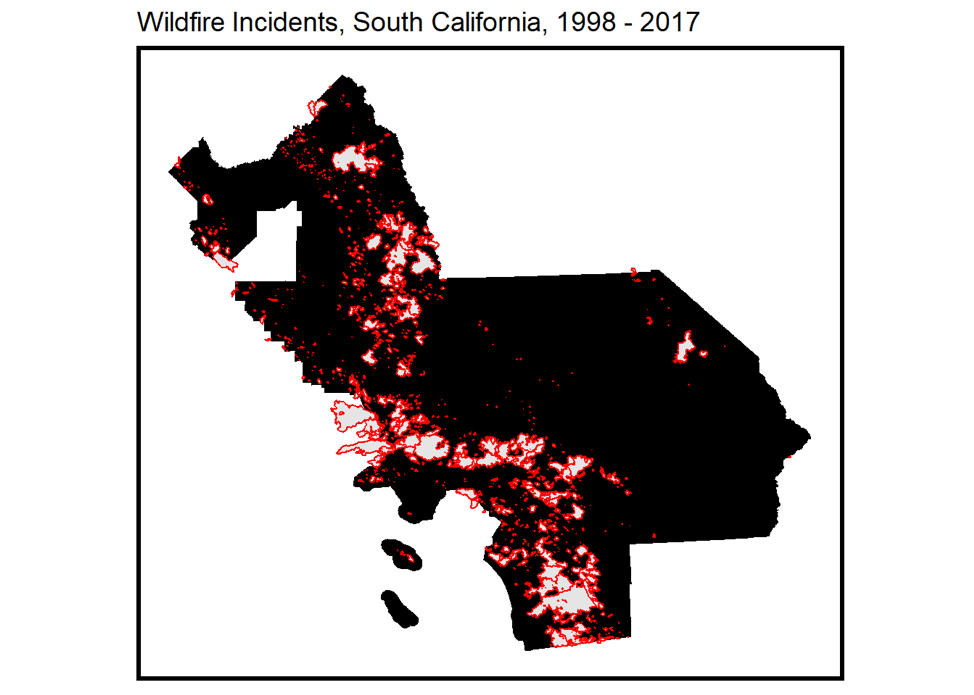
For this project, we developed a model that spatially predicts wildfire risk to help policymakers propose land use plans and suggestions to reduce the loss of lives and capital. Forecasting risk in such a way will also allow officials to better plan Direct Protection Areas (DPA) and help relevant departments effectively allocate limited prevention and firefighting resources. The map below shows the spatial extent of all the wildfire incidents in Southern California in the past 20 years.
Data
We filter the wildfire data from the California Department of Forestry & Fire Protection and built a dataset of 45 variables in 7 categories, including geography, topography, climate, protection policy, and historic fires for the study area from 1998 to 2017. The study area is composed of 7 counties that have the most wildfire incidents, including Los Angeles, San Diego, San Bernardino, Riverside, Kern, Fresno, and Tulare.
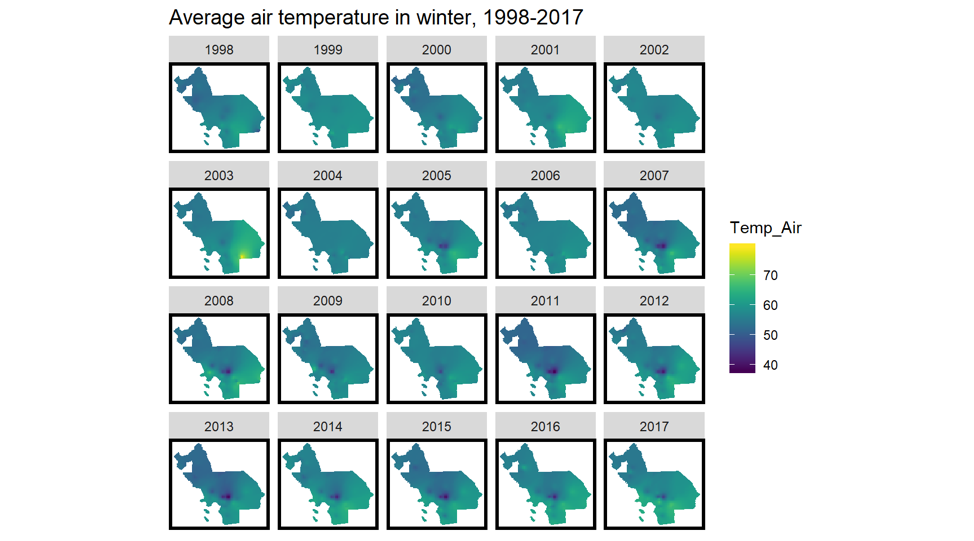
For instance, the climate data come from each weather station scattering around the study area. Five climate parameters which are assumed with having stronger correlations with the probability of wildfire are picked for the model. After selecting specific stations, we use the time factor to calculate the values in every season. Then, we import the updated dataset to ArcGIS, create IDW (Inverse Distance Weighted) interpolation surface and use zonal statistics function to obtain continuous climate data. The maps below present the changes in average air temperature in winter during the 20 years.
Modeling
The goal is to balance accuracy and the generalizability across counties.
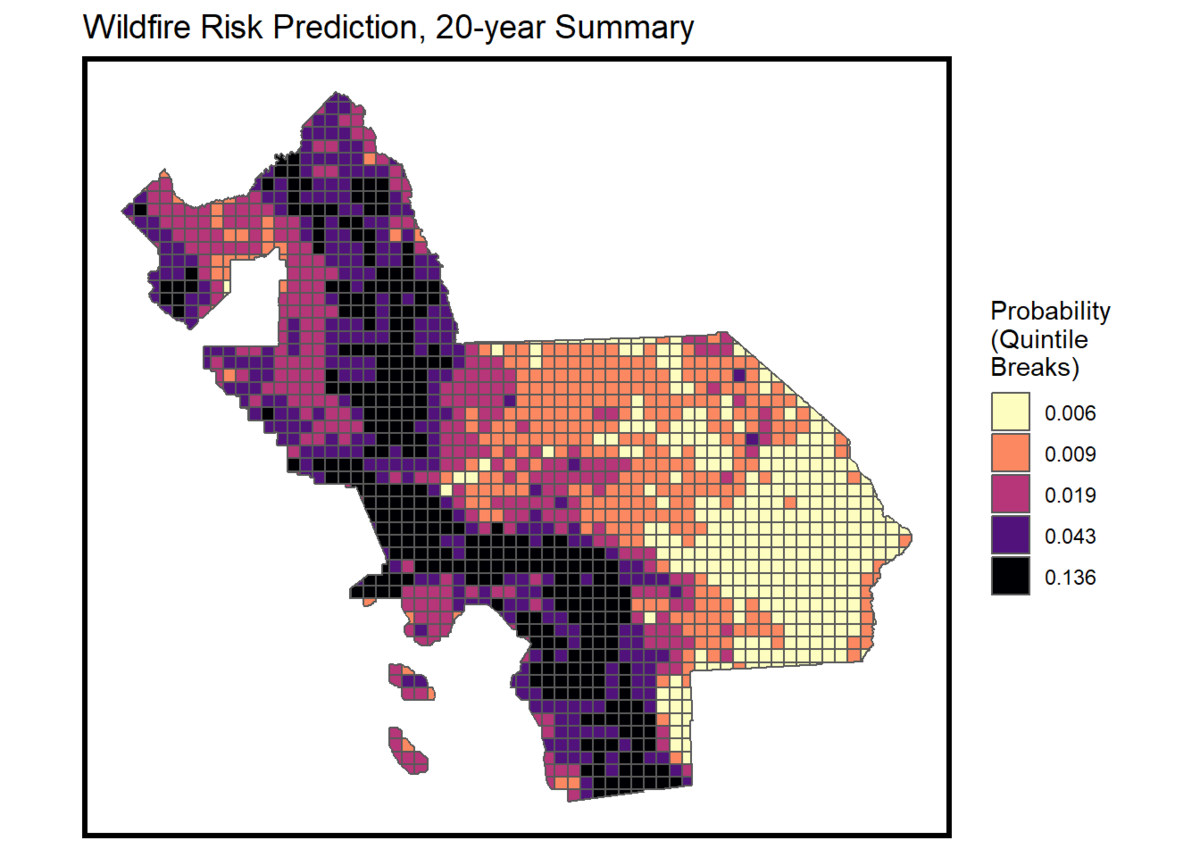
In this research, we use the logistic regression model since the dependent variable is the probability of wildfire. In the beginning, all variables are added to the original model; then the statistically insignificant ones are removed by the stepwise method. According to the VIF (Variance Inflation Factor) test, we manually get rid of those predictors with values higher than 10 for the possibility of multicollinearity. Ultimately, the final in-sample model is the one with 29 parameters. The map below presents the predicted fire risks in the study area.
Results
We validate the model from its accuracy and generalizability.
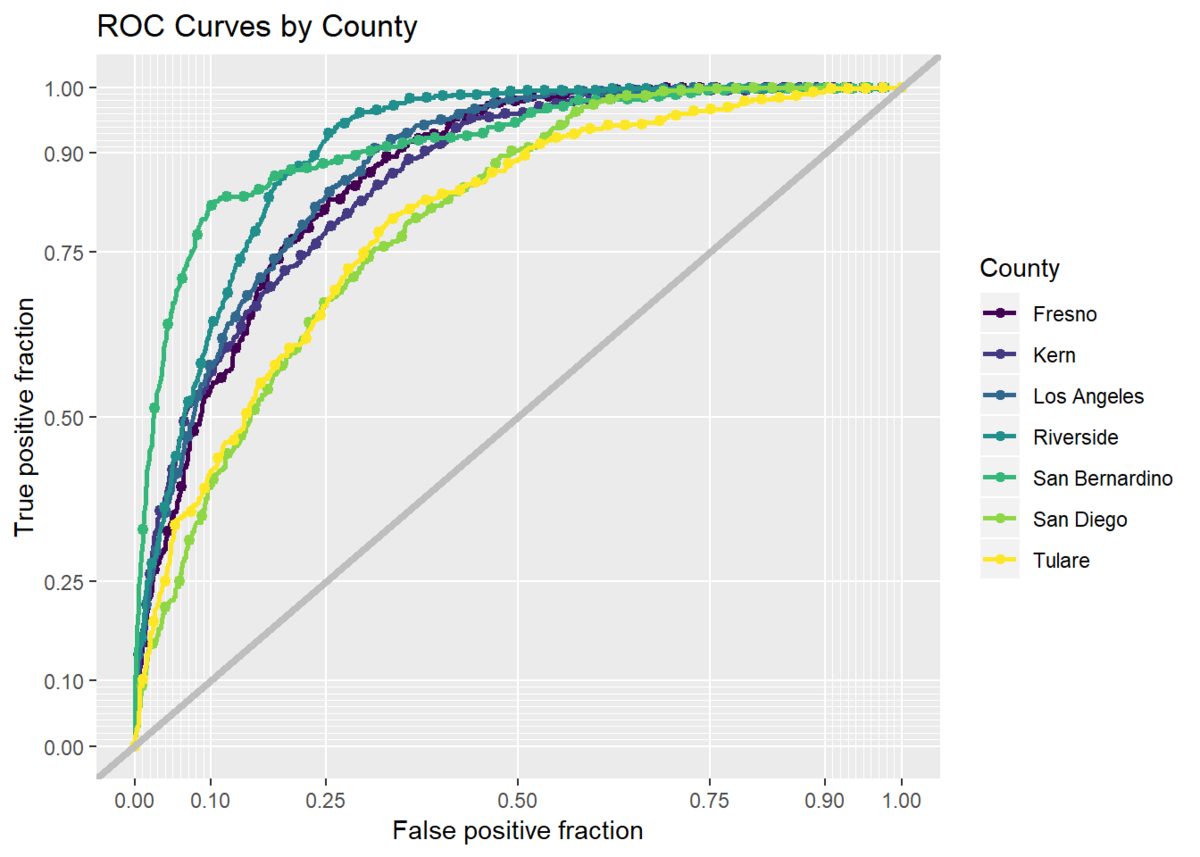
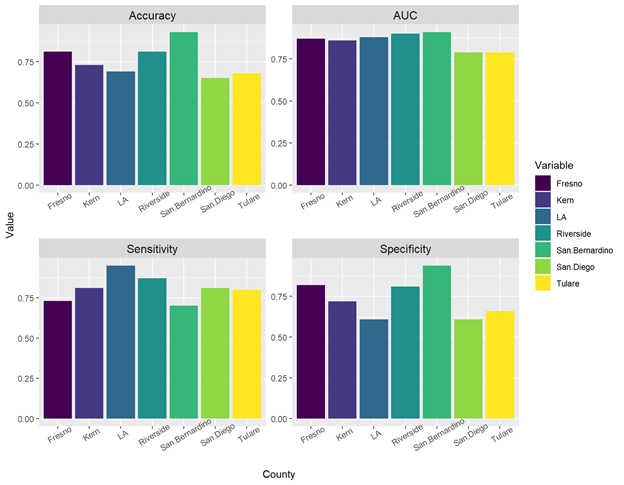
First, to estimate the accuracy of the model, we perform cross-validation using 75% of the entire dataset as the training set and use the trained model to predict the 25% test set. We can predict wildfire across space with accuracy rates above 75%. We also evaluate how generalizable the model is across county. Both ROC curves and confusion matrix statistics by county show the model is less effective in some places than others and reveal how we might improve the model.
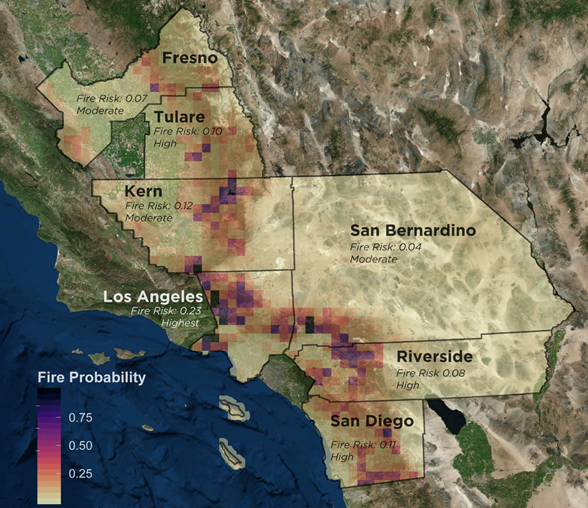
Visualizing wildfire risk
Derived from our model, the map below shows how much and where the high-risk areas intersect with development. For example, in Los Angeles, San Diego, and Tulare, more than half of the development areas are at a high-risk level, especially in wildland-urban interface areas.