Stuart Weitzman School of Design
102 Meyerson Hall
210 South 34th Street
Philadelphia, PA 19104
Get the latest Weitzman news in your Inbox
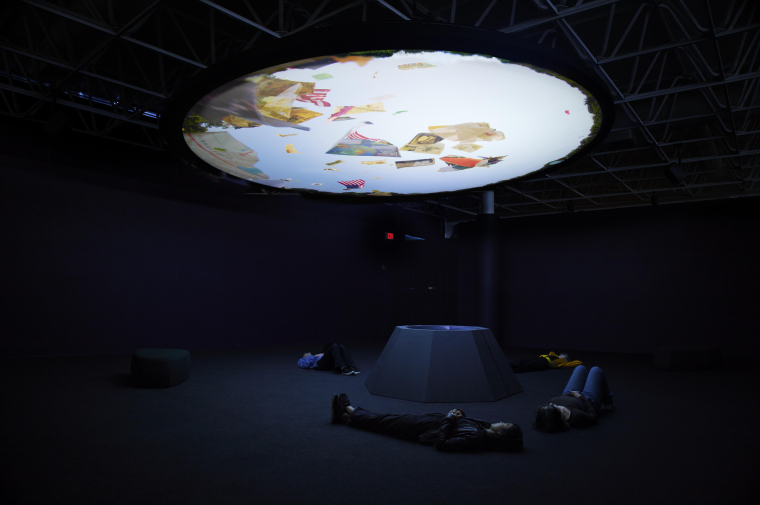
 Expand Image
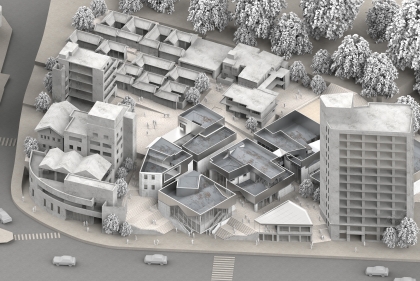

Media Contact
Michael Grant
mrgrant@design.upenn.edu
215.898.2539
This year, Dana Tomlin is retiring from the Department of Landscape Architecture in the Weitzman School of Design, where he has taught courses in cartographic modeling for thirty years. A beloved educator and respected pioneer in geographic information systems (GIS) and mapping, Tomlin has received the Perkins and Lindback Awards for Distinguished Teaching at the Weitzman School. He has also served as a member of the Faculty in City and Regional Planning. And he will continue to teach as an adjunct professor in the Yale School of Forestry and Environmental Studies, where has taught every semester since 1990.
On September 29, the Weitzman School will host A Celebration of A Life Visualizing Complex Information to honor Tomlin on the occasion of his retirement. In this interview, he speaks about the evolution of mapping technology and its growing importance in daily life, using geospatial data to guide decision making, his split interests in the art and science of map making, and teaching at Harvard, Yale, Penn, and the Ohio State University. The interview has been edited.
You’ve spent your career in GIS. How have maps and map making become more central to our experience of the world in the time since you began your career, in your observation?
When I started in the 1970s, the prospect of using a computer to process numbers was nothing exotic, but the idea of using a machine to process words, if you can believe it or not, was new and different. The idea of a word processor was pretty special; at that point one had to go to a computer center in order to gain access to the software necessary to do that. It wasn’t until 1980 or so, when we moved to the desktop, that the prospect of moving from numbers to words and now pictures was even really conceivable. At that point the idea of a graphic interface was pretty sexy and interesting. Moving from graphics to maps in the 1980s was a relatively small step in terms of the media, but in terms of the implications for processing maps in an automated manner, that was something that we didn’t anticipate even then.
Back then the idea was to bring more reality into the lab, to make maps more evocative and realistic and so on. It wasn’t until the 1990s, the advent of the Internet really, that the prospect of bringing more of the lab into the field became even thinkable. Nowadays we don’t even think of it, because we take geospatial data and we hold it in our hands. This progression from numbers to words to pictures to maps, and then this reversal— bringing more of the lab into the real world as opposed to bringing reality into the lab—really does mark a significant progression.
From my perspective, there’s no question that if you look at the earth as an organism, we are building the nervous system of that organism. There’s an ability to sense the world around us, an ability to abstract it and an ability to respond to it. This is all happening today largely around a language, a perspective that is oriented more toward where than it is toward what or when. The geospatial framework is so compelling for everything that we do that this technology finds itself becoming more and more important.
Did your interest in maps originate from a particular spatial experience you had when you were young, or was it something you became interested in at school?
The fun answer to that is one that’s actually true. I had a children’s book called Scuffy the Tugboat. On the back of this “Little Golden Book” was what amounts to a picture map of all the adventures that Scuffy had moving down the river. That birdseye perspective is one that I’ve often thought of since, and I’m convinced that it was compelling.
But to answer the question more soberly, I would say that, when I was an undergrad in a landscape architecture program, I was among those who felt that the advent of computing was downright evil, that it took us away from the real world and all of the artsy, design-y inclinations that we had and automated things in a negative way. I felt differently a few years later going to grad school. I felt so intimidated that I needed to jump into it. So I did, and I found that I was good at it. I found that I could make the machine do what I wanted it to do in ways that surprised me. That was absolutely compelling.
We are at a point where the use of maps as media to compel is not nearly so powerful as the use of maps to simply navigate, to simply tell us about the weather, or crime statistics, or the market value of real estate, or health conditions.
What do you think are the most notable GIS innovations that have been achieved during your career?
The capability that has been most important and promises to be most important in the near future is the ability to simulate the world around us sufficiently well that we can interact with those simulations in a game-like manner. Drawing on non-rational as well as rational decision-making faculties, so that we simulate not only what the environment looks like but also its sensitivity to environmental impact, its likelihood of generating disease, crime, fiscal benefits or problems. If we can create software that simulates futures, we have the ability to play with those futures. I think this has always been the major contribution of GIS from the beginning. We have the ability to generate futures, we can simulate aspects of the real world, we can then move into things like hydrological models and traffic models and air pollution models that simulate not the way things look but the way they behave. And I think the prospect of improving on those kinds of simulations is the most promising way in which this field is likely to contribute in the near future.
You recorded a lecture last summer and said something like, “Maps shouldn’t just illustrate information but should also compel behavior in certain ways.” That was in the context of COVID-19. How capable do you think maps are of compelling people to behave in certain ways and what the limits are of that function of mapping?
The ability to affect behavior is profound, particularly to the extent that it is not direct. It is not frontal. We are at a point where the use of maps as media to compel is not nearly so powerful as the use of maps to simply navigate, to simply tell us about the weather, or crime statistics, or the market value of real estate, or health conditions. The sort of thing that we’ve done for decades with traffic prediction and traffic helicopters—imagine the same sort of thing being done for weather, crime, health, real estate. How does that improve in the future? Clearly, it’s by doing away with the expert and replacing the expert with observations about actual human behavior.
Just driving down the road yesterday, I was alerted to a highway backup, and it was the most normal thing in the world for me to change my behavior and drive around it. We don’t even think about that anymore. But do I do the same sort of thing if I find that there’s a COVID hotspot? If I could, I would. Do I do the same sort of thing regarding the flash flooding that we’re confronting? If I could, I would. It’s the indirect influence and weaving this technology into the fabric of our everyday lives that I think represents the greatest potential influence.
You’ve taught at Penn, Harvard, the Ohio State University and Yale. What have you gained from teaching in general and is there anything unique about the experience at Penn?
I was at Harvard for a decade, where the landscape architecture program was heavily oriented toward GIS, even back in the 1970s. I then elected to leave Harvard and go to Ohio State because it was one of several focuses of activity in this field, and although I only stayed there for three years, it was very important to my career. It really introduced me to serious colleagues in the field of GIS. Moving from Ohio State to Penn and to Yale, which I did simultaneously, was a move that enabled me to have one foot in the arts and one foot in the sciences simultaneously. For the past 30 years, I have been teaching full-time at both Penn and Yale and it’s been delightful. As to the students, those at Penn tend to be oriented more toward the arts, those at Yale more toward the sciences, and that combination is what I’ve found so appealing.
Do you think GIS is going to be increasingly specialized or do you think it will be increasingly integrated into other skill sets?
Definitely the latter. Much like statistics did decades ago, which was sort of disappear into the various disciplines where it has a role to play, I think the same thing is going to be true in terms of GIS. We’re going to find that those who do GIS work in real estate or archaeology or environmental planning are going to not think of GIS as separate from their own domains.
Is there anything else you’d like to share?
That’s the most difficult question you’ve asked. When I first got into GIS, as a student at Harvard in the mid-1970s, there was a palpable feeling of enthusiasm for what could be but wasn’t there quite yet. Every month computing power would increase, the prospect of doing niftier things was shared by those who were nerds in the field, and to a great extent I see the same sort of thing today, largely because of the enormous power to collect data, to interpret those data, and to generate compelling results and to do so immediately by way of social media for which there’s just no precedent in the past. What is different is that I see it in multiple fields simultaneously. I have students who are interested in climate change, wildlife modeling, traffic simulation, hydrological phenomena—the opportunity to make a splash is there today the way it was back in the 1970s, and I find that very very encouraging. It’s why I continue to play in this playground.