 Expand Image

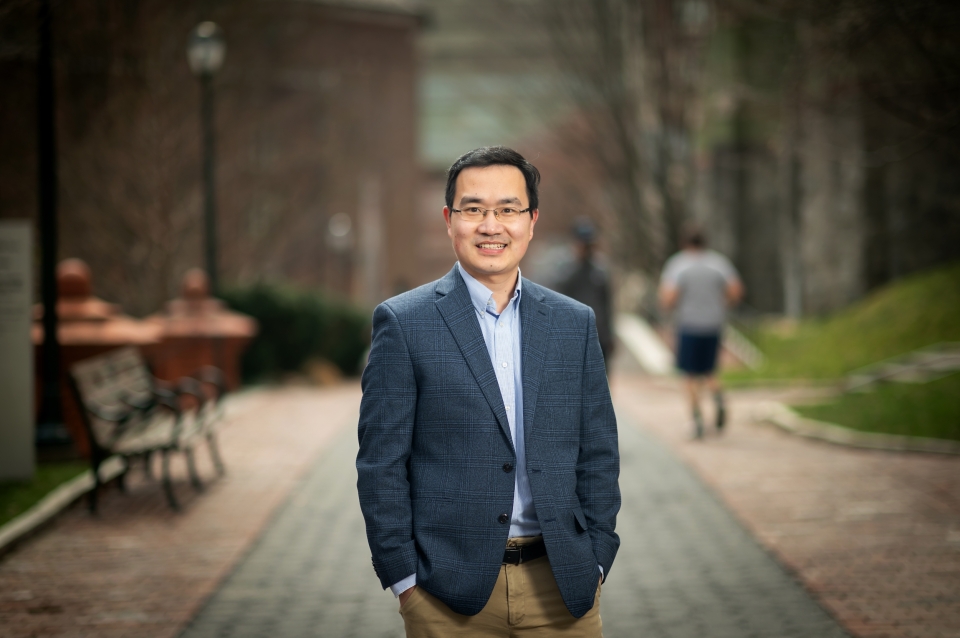
Assistant Professor of City & Regional Planning Xiaojiang Li, who joined the standing faculty of Penn earlier this academic year, uses urban analytics and geospatial data science to improve urban resilience and environmental health. In an interview, Li, who introduces Master of City Planning and Master of Urban Spatial Analytics (MUSA) students to the power of AI, describes recent developments in urban spatial analytics.
What are you teaching this semester?
I am leading two courses this semester. AI for Urban Sustainability is a brand-new course that I developed. Our Master of City Planning students get a very good background in programming with Python or R, but many of them are looking to learn about how AI can be used for their research and their projects. So, I developed the course to teach students both practical and advanced skills on how to use AI for processing spatial data, conducting urban models, and to tackle different urban issues.
In the course, students learn some advanced spatial data science, like how to use Python to process remotely sensed imagery, digital terrain model, and street-level imagery. They also learn how to use different kinds of GIS data efficiently and how to use GPUs [graphic processing units] for urban shadow analysis. Finally, they use machine learning and deep learning to process street view or aerial imagery, which can be used to audit and map urban environments. The course asks them to use these new skills in real applications. The course is very popular and is registered to capacity.
The second course is the Practicum for Smart Cities, where I work with students on their independent projects. They are coming from very different backgrounds, wanting to do different kind of projects. My approach is to provide them with some general skills on how to manage their project and how to access the data they need, while also sharing some analytics skills for spatial analysis. I also work with them on how to visualize their results. This is an important part of the process because students have to find some way of visualizing their findings to share the information. It’s a form of data journalism and makes their project more accessible to a wider audience.
The urban spatial analytics field seems to be in a time of change. There are new ways of collecting data and new ideas for how to utilize the data being corrected. What developments are you most excited about and how has this impacted your teaching?
First, there is the open-source movement. A lot of MUSA students are using open-source tools for their projects, which has increased the reproducibility of the research dramatically. Many projects include the code that was used, so other students, or other researchers, can easily reproduce the results, while applying or modifying the code for their own project.
Secondly, students are thinking about how AI can be used in their work. A lot of GIS data and urban data that traditionally has been used for research was a form of structured data. For example, census data or survey data. But now, new types of data are becoming valuable. For example, Google Street imagery or real estate listings, which are types of data that help us understand our city from new perspectives. These are examples of unstructured data, which were not easy to process before now. By using AI, we can process and extract useful information accurately and efficiently. We can understand our cities’ social environment systems in more detail now.
I'm fairly open to students using AI for some, but not all, of their writing and programming. It’s important that students understand the code they are working with. And they need to put their thoughts into the programming and their writing.
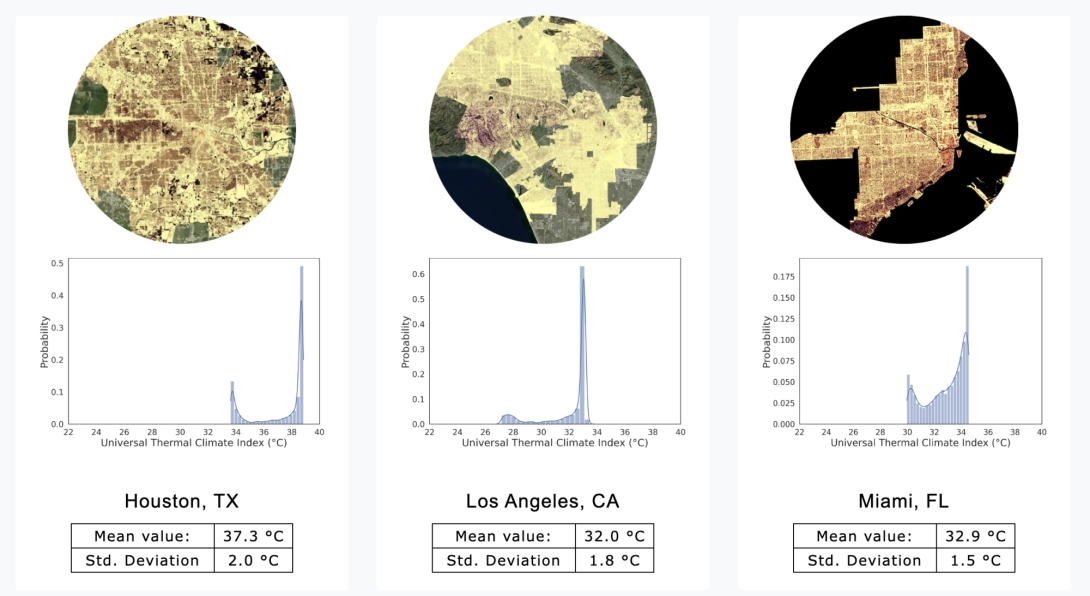
Three of the 18 cities profiled on Urban HeatExpo
You have done quite a bit of research on heat islands and urban settings. Could you summarize those projects?
I do a lot of work on urban heat modeling and mapping—studying how heat impacts people—by creating maps of the impact of this heat at a hyperlocal level. Our cities are getting hotter, much hotter than surrounding suburban areas, and extreme heat in the summer is becoming more frequent. This has become a very prominent, or maybe the primary, public health hazard for our cities. There are reports showing that extreme heat impacts more people than all other environmental hazards combined, but this impact has not received the attention that other causes do. Sometimes it is called the silent killer.
Traditionally, satellite imagery has been used to map and quantify urban heat. The problem with that is that satellites tend to capture surfaces from the top to down, meaning it may measure the temperature on the top of a building or a tree. But nobody lives on top of a building or tree, nobody works there, nobody is standing there.
I'm looking at things on a more hyperlocal level, studying the ground surface, looking at how buildings and trees provide shade and how that shade impacts the heat in a specific location. We then analyze how people are impacted by the thermal environment at the pedestrian level.
I have generated a database of heat data from many cities across the country using this pedestrian-level method at a one-meter resolution. I can also use this database to show how the heat changes overtime in one day, which allows me to make predictions for every hour, showing the impact of shade and how it effects our heat stress level. By looking at a hyperlocal level, with much finer temporal resolution, I can study how extreme heat impacts people in a much more detailed way.
Right now, I'm working to combine the hyperlocal microclimate modeling with urban analytics to study how extreme heat impact can impact pedestrians when they walk from their home to nearby transit stations, for example, or a playground or park. Then we can begin to make plans on how to mitigate this extreme heat. The City of Philadelphia is working to increase trees coverage, but where should we plant those trees? Where can we maximize the benefit of those new trees?
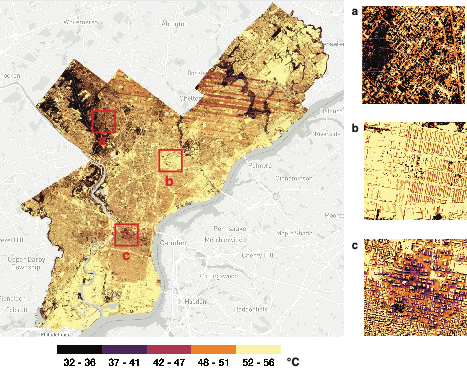
The spatial distribution of resident’s outdoor heat exposure across neighborhoods of Philadelphia using urban microclimate modeling.
When you have applied this method, are you seeing differences in different neighborhoods in Philadelphia?
In Philadelphia, if you check the map for the northern part of the city, there are a lot of row houses, very little greenery, and a small number of trees. And those areas are much hotter. But if you go to the northwestern part of the city, neighborhoods like Chestnut Hill, there are a lot of trees, and you can see the difference. In Center City, there are both a lot of trees, as well as high-rise buildings that provide shade.
Looking at different neighborhoods in Philadelphia along with other cities, it is clear that income is the most important factor related to exposure levels to extreme heat. Generally higher-income people live in neighborhoods that are cooler, while lower-income people live in hotter neighborhoods. The data shows this general pattern in Philadelphia and also seems to apply to other cities. We have applied the model we created for Philadelphia to many other places across the country, and maybe it could also be applied to places across the world.
Do the benefits of a tree canopy vary by city?
I developed a project called Treepedia several years ago when I was doing a postdoc at MIT. That project used Google Streetview images and deep convolution neural networks to automatically recognize trees and to quantify the distribution of street level greenery at a hyperlocal level.
Trees can be placed in many places, but for urban trees, it is better to add them closer to people. Using that measure we can better quantify where to put trees so people can perceive the trees in their day.
Urban trees provide different kinds of benefits beyond shade. The trees generally make pedestrians feel happier and increase the feeling of walkability in cities. These benefits are probably the same for almost everywhere around the world, unlike the benefit of shade from trees, which varies by the climate of the location.
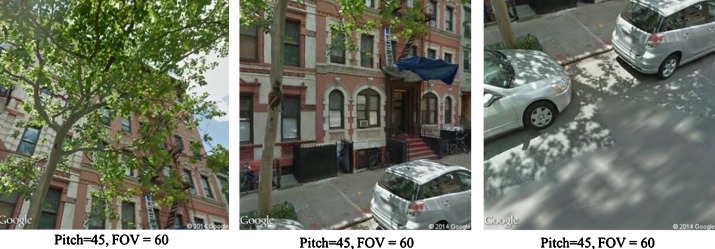
Google Street View images of a site with different vertical view angles.
Trees can be placed in many places, but for urban trees, it is better to add them closer to people. Using that measure we can better quantify where to put trees so people can perceive the trees in their day.
Psychologically speaking, it is difficult to say how trees impact people exactly, but we can say generally that people like greenery, and that people like the trees when they walk along city streets. So, with Treepedia we quantified the visibility of greenery, simulating a pedestrian walking along a street and how much greenery they see. We can then use aggregation to quantify the amount of greenery at the block level or at a neighborhood level or at city level, which allows for the data to be seen from multiple perspectives.
We developed a kind of ranking system, which ranks different cities in terms of the amount of greenery. Every city says it want to have more street trees, but this ranking tells you how you compare with other cities. The project showed people in some cities that they were performing pretty poorly. Several cities that are working on plans to increase their tree canopy coverage based their planning on our ranking results.
How does your research influence the way you think about Philadelphia and its future?
I have been in Philadelphia for almost six years. Other than my childhood home, this is the city that I have lived in longest in my lifetime. When I drive through Philadelphia, commuting to school or from other places, I notice how different parts of the city are from each other. I have also seen how some neighborhoods have changed over time. You can see Google Streetview imagery from the last ten to 20 years for a place, which also lets you see how the neighborhood has changed over time.
I always think about how my research can help when I drive or walk through the city. I have two young kids and when I take them to nearby parks, I always think about ways to mitigate the heat you experience there in the summer—how to provide more shade and where we could see more greenery. Walking from my home to the grocery store or a bus stop, I think about how we can use a hyper-local heat-level map to make plans to minimize the exposure to high heat.
Philadelphia has plans to increase its tree canopy cover by 20% in the near future. But where should we put those trees? How can we maximize the benefits and optimize our investment? All of these things can be solved using these measures.
Using the tool I'm developing, we can evaluate the benefits we actually can achieve before we invest in this kind of practice, and we can do that at the scale of cities. This can be used as an information system that will help people understand how this planning can impact how heat levels will change, by doing things like planting more trees, or changing the color of ground surfaces using white pavement. Before we invest a lot of money, we can evaluate how effective the results will be, which would be very helpful in the planning process.